|
Overview
SpotFinderZ (from now on simply SpotFinder) detects round, usually diffraction-limited spots
inside bacterial cells outlined with MicrobeTracker and
places them into the meshes structure produced by MicrobeTracker. The program is written in MATLAB and saves the data in
the MicrobeTracker format by appending additional fields.
Buttons and controls
 |
|
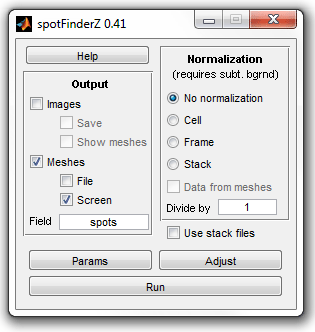
Main window of SpotFinder |
Output
-
Images - displays images with detected cells;
-
Save - saves the images (the program will ask for the first
image name and then will increment the number);
-
Show meshes - displays meshes when displaying images;
-
Meshes - save meshes;
-
File - output them to a file (the program will ask for the
file name);
-
Screen - output the array to the workspace.
Normalization
-
No normalization - default mode;
-
Cell - divides the intensity of every spot inside a cell by
the mean intensity inside this cell;
-
Frame - divides the intensity of every spot inside a cell by
the mean intensity of the cells on each frame;
-
Stack - divides the intensity of every spot inside a cell by
the mean intensity of the all cells in the stack;
-
Data from meshes - if checked, extracts the data from Signal1
field in the cellList structure, otherwise obtains it from integration of the
image (in this case the image has to be background-subtracted).
Other controls
-
Help - displays this page in MATLAB browser;
-
Use stack files - loads images from stack files (multiple formats are supported, must be single channel), only works if Bioformats software is installed;
-
Params - edit, load and save the parameters;
-
Adjust - run adjustment mode to get the right parameters by
clicking on the spots;
-
Run - run the program for every cell.
-
Use on range of frames (appears if you press "+" and
dissapears if you press "-" on the keyboard) - the range of frames to use for
parameter adjustment and spot detection; empty fields correspond to the
beginning / end of the whole range.
Adjustment mode controls
-
Previous/Next or left/right arrow on the keybiard - go to the
previous/next cell to train, the properties of the spots on the displayed
cells and their selected/unselected states are memorized;
-
Update params - update the parameters using the memorized set
of previously displayed spots; the last 6 parameters in the parameter list are
those that are updated;
-
Stop - terminate the adjustment mode; the parameters are
updated automatically, unless a parameter window is open;
-
Adjust contrast of the current image (appears if you press
"a" on the keyboard).
Output format
The output format is based on
that of MicrobeTracker. It is saved
as standard .mat files, which can be opened with MATLAB without running
MicrobeTracker or SpotFinder, with all SpotFinder results appended into the
cellList variable, and the parameters saved as the params
variale.
The cellList variable is a MATLAB cell array with a hierarchical
organization. It is an array of frames, each being an array of cells, each being
a structure of fields describing one biological cell on one frame. Among those
fields there is one called spots, which is produced by SpotFinder. The
spots field has several subfields, listed below:
-
l - coordinate along the centerline.
-
d - signed distance from the centerline.
-
x - euclidian coordinate from the left of the image.
-
y - euclidian coordinate from the top of the image.
-
position - segment number in which the spot is located. The spot
can be outside of the cell if nonzero Expand cell parameter is used,
in which case position would be zero.
-
b - background under the spots (one of the Gaussian fit parameters).
-
w - width of the spots (one of the Gaussian fit parameters).
-
h - height of the spots (one of the Gaussian fit parameters).
-
magnitude - brightness of the spots (combined brightness under the
Gaussian fit excluding background).
The parameters x, y, b, w, and h are
obtained by fitting the spot to the function
b+h·exp{-[(x0-x)2+(y0-y)2]/w2},
where (x0, y0) is the current point, the
parameters correspond to the mentioned fields of the spots structure. The
values of the l and d fields are calculated by projection of the
spot center onto the cell coordinate system, the value of the magnitude
field is calculated as πw2h.
Parameters
The typical values are shown for images obtained using a 100x objective at
0.064 μm/pixel resolution unless mentioned otherwise. The parameters
from Max width and below are adjusted by training,
usually there is no need for manual adjustment.
- Expand cell - Amount of mesh expansion in order to take into account the fluorescence outside the cell because of diffraction and aberrations. Real positive number, in pixels.
- Exclude other cells - If checked, the program will not pick spots located outside of the countour close to the contour of another cell.
- Low cutoff - Lower cutoff of the bandpass filtering step. Integer number, in pixels.
- High cutoff - High cutoff of the bandpass filtering step. Integer number, in pixels.
- Min filtered height - Minimum spot size after filtering (before fitting) to be considered introduced to reduce processing time by removing false spots sooner.
- Fit area size - Radius of the area used to fit spots. Larger areas produce more reliable fit, but increase interference with neighbor spots. Real positive number, in pixels.
- Resize - Factor to resize the image (for example, if it is 2, the number of pixels in each direction doubles) to detect spots more presizely. Real positive number.
- Shift limit - Factor responsible to attraction of the spot to its originally detected position. Non-negarive real number, default 0.01. Reduce 10-100 times if spots stick to pixel centers losing subpixel resolution (use testspotprecision function to test). Try increasing if the program ocasionally rejects good spots.
- Remove ridges - If checked, the ridge removal filter will be applied to ensure round-shaped spots.
- Scale factor - Factor to scale all size parameters below (such as cell width and errors) to use fitted parameters for cells imaged at different resolution.
- Max width - Maximum allowed width of a spot. Real positive number, in pixels squared.
- Min width - Minimum allowed width of a spot. Real positive number, in pixels squared.
- Min height - Minimum allowed height of a spot. Real positive number, in image units.
- Max rel. squate error - Maximum allowed relative square error.
- Max var/sq. area ratio - Maximum allowed ratio of the variance on the age to spot area.
- Min filtered/fitted ratio - Minimum allowed mean ratio of the filtered spot to fit.
Usage example
In this example we use images of Caulobacter crescentus CB15N cells
expressing CFP-ParB that localizes at the chromosomal origin of replication. The
images (phase contrast and cfp fluorescence) are places in the
\examples\spotfinder\ subfolder of the MicrobeTracker folder. The cells
were outlined with MicrobeTracker, with the result saved in
meshes.mat file in the same folder. To dislay the
contours on top of the phase contrast images select the mentioned folder as
the active MATLAB folder (otherwise the files will not be found) and type
the following commands in MATLAB workspace:
>>images = loadimageseries('phase_images');
>>load('meshes')
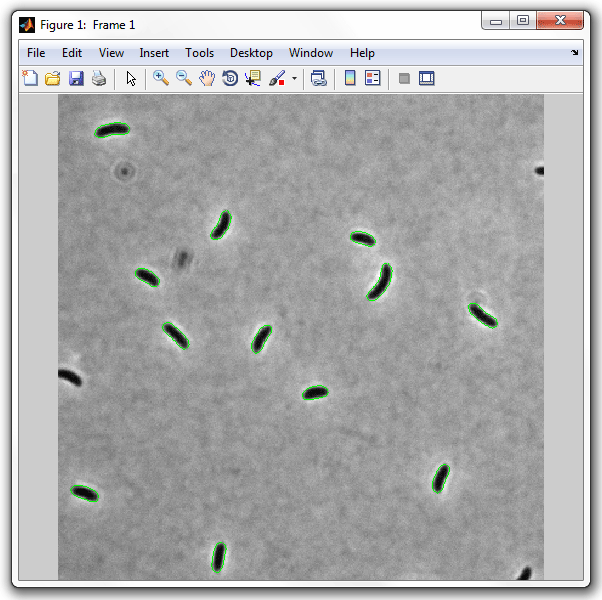
>>dispcellall(cellList,images)
This will display the image below. Note, the number of images will be the
same as the number of original images. Therefore, you may want to limit it if
the number of files is large (see dispcellall
tool). Note, dispcellall creates new figures, so you do not neet to use
the "figure" command.
Now run SpotFinder:
>>spotFinderZ
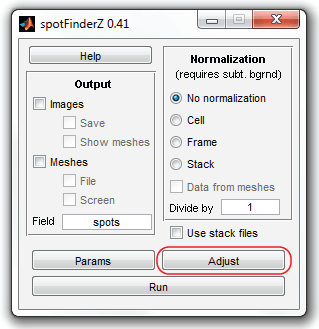
And click "Adjust" button to modify the quality parameters for this image
set. The program will prompt you for the input images folder (file) and the
meshes file. Select cfp_images folder and
meshes.mat file. In what follows, you have to go
through several cells clicking on the "real" so that they are displayed in red
and unclicking the "false" spots.
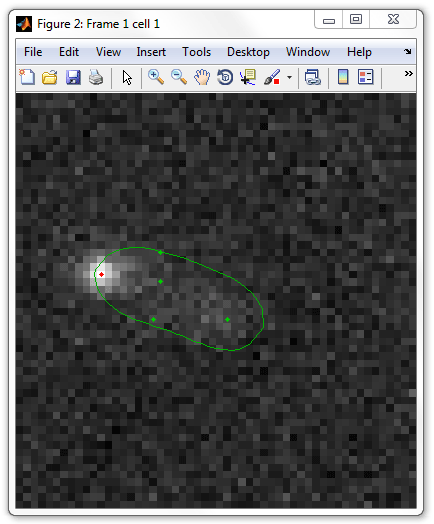
The navigation is performed by "Previous" / "Next" buttons of SpotFinder,
"Stop" button will terminate the adjustment regime. "Update params" button is used
to adjust the parameters and evaluate the spots on the next frames according to
the newly set parameters. The number of cells to click on may be as small as
just a few, but more cell will improve the quality of detection.
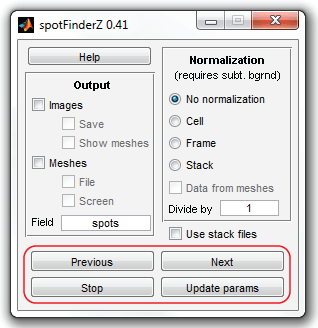
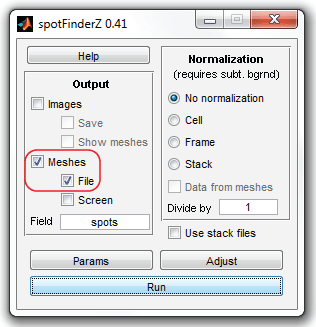
When you are done and have clicked "Stop" button, SpotFinder will return to the
original view. Select now "Meshes" and "File" checkboxes to save the data at the end
of processing into a file and click "Run" button.
The program will prompt for the file and folder names. Select the same input
files and folders (will appear by default) and a different file for the output,
for example meshes+spots.mat (make sure, the
\examples\spotfinder\ folder is still the active
folder in MATLAB). The program will process the images while displaying a
progress bar and will save the data automatically. To view the results type:
>>images = loadimageseries('cfp_images');
>>load('meshes+spots')
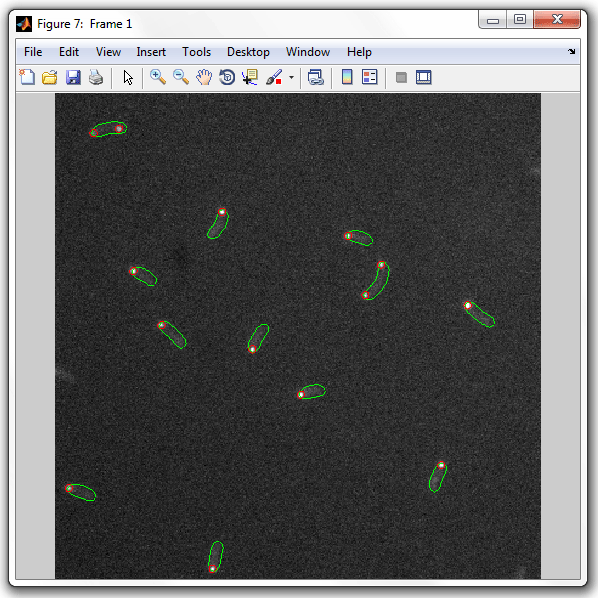
>>dispcellall(cellList,images,[],[],[],[],3,'circle')
Which will display the data indicating the spots with circles of the radius
of 3 pixels:
|